
Business Update - Grab Q1'25: Strong Operating Leverage, Tariff Resistant, Solid Growth Runway, One Negative
Q1 results has one negative. MTU up 44.5M (+16%), GMV $4.9B (+16%), Adj. EBITDA (+50% est.), 4MOUs in AV. Acquisitions to expand Mart (Everrise) and Fintech (Validus). Trading at 25 P/FCF.

Grab outperformed in Q1, despite uncertainties and the slowest quarter seasonally. Let’s review the key KPIs and then the essential bits.
One negative
Sleep Well’s number one focus
Long-term growth - Demographic, Products, and Acquisitions
Others - Fintech and AV
Valuation
Grab readings - deep dive, why I bought, Q4’24 review, Local Competition & AV risk,

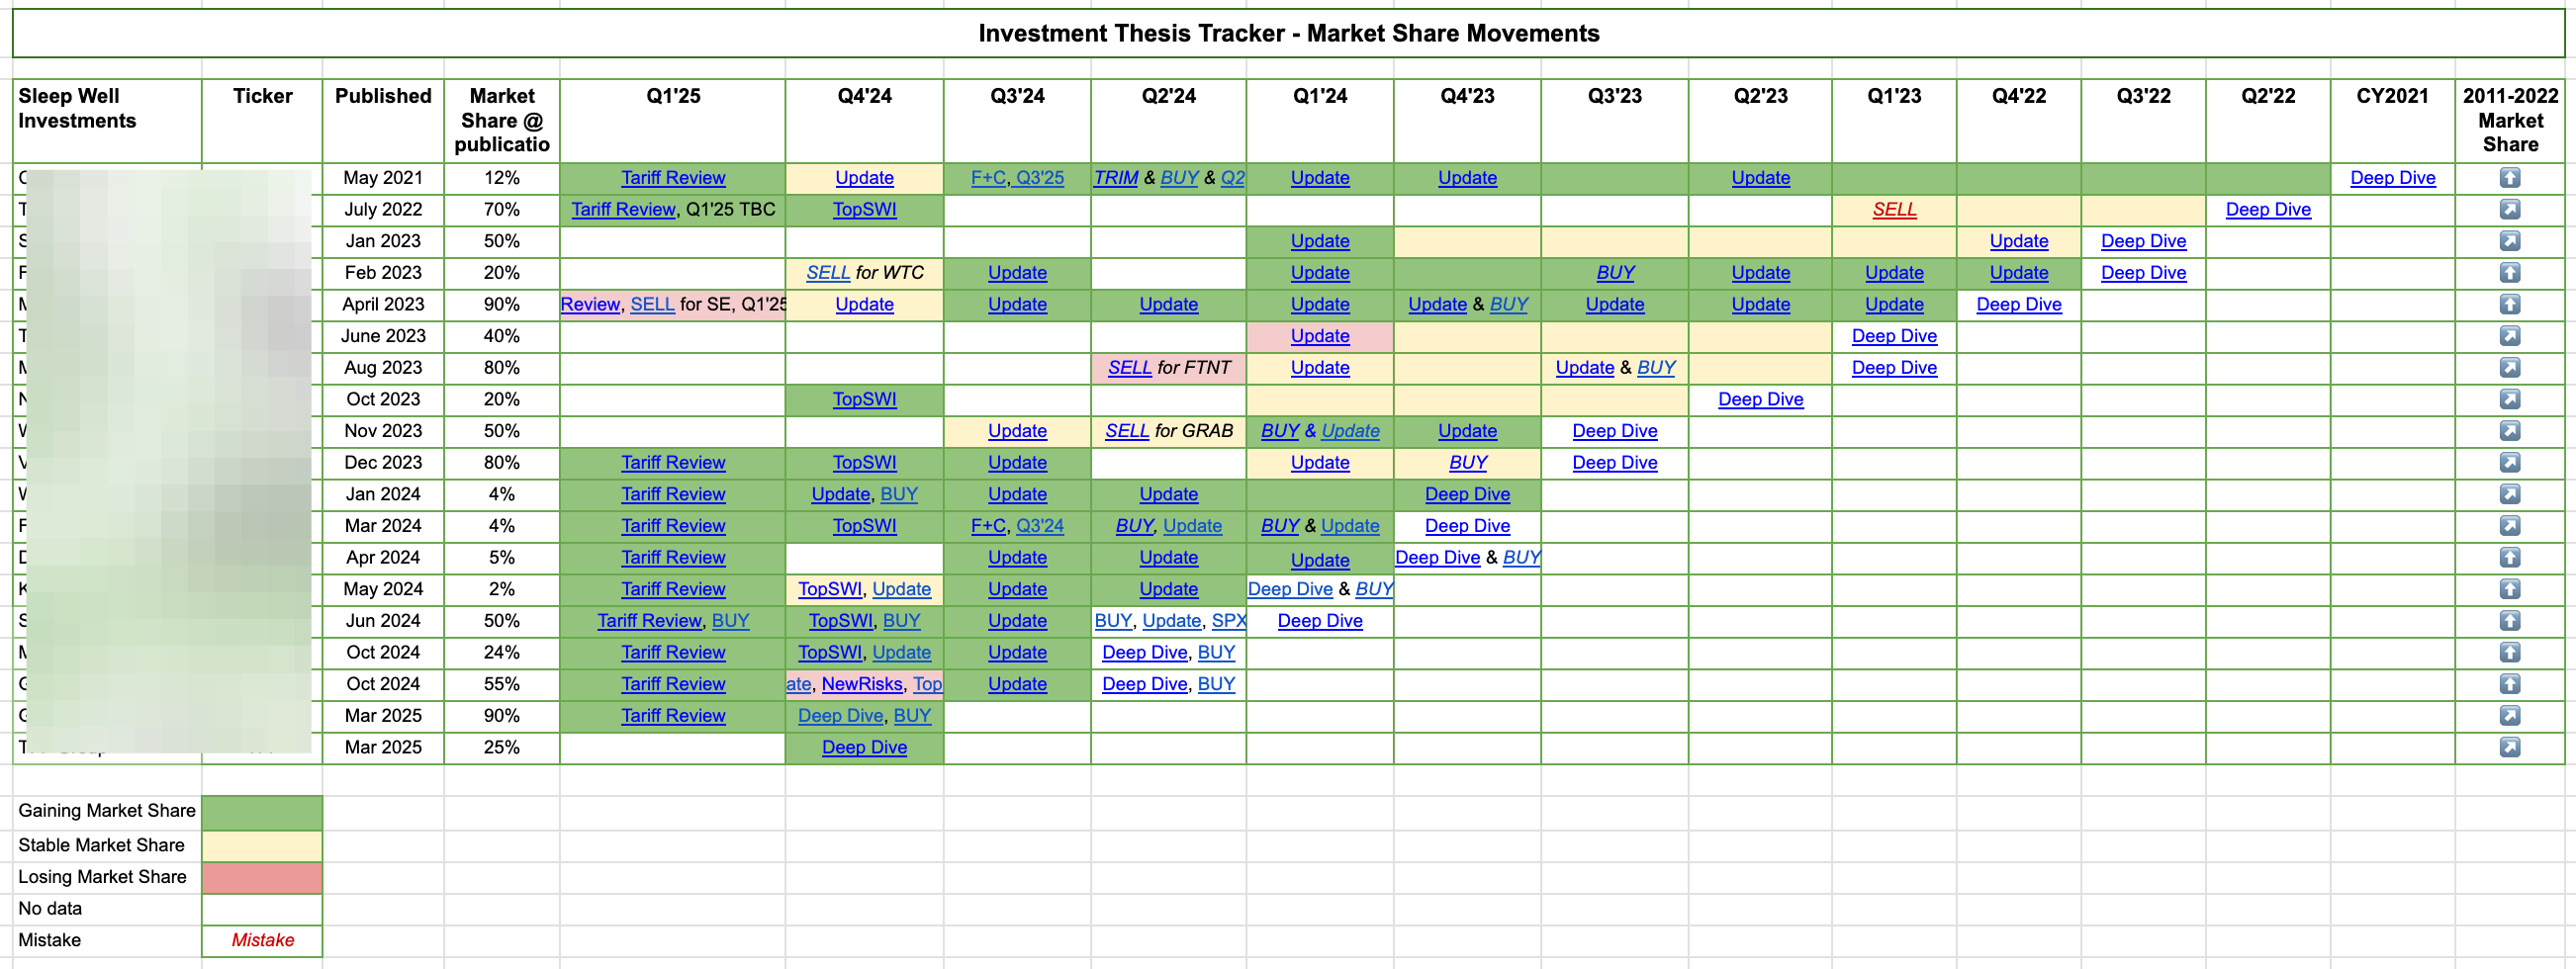
As a reminder, I focus on the long-term story/execution of the business, not the quarterly Wall Street beat/miss quarterly records. So, my thesis tracker primarily checks how my picks build their value propositions, cope with adversity, and maintain/grow moats and market share.
Q1 2025 thesis tracking so far:
MELI and SE, our largest positions, report on 7th May and 13th May.
To track all business results, buy/sell notes, ad hoc updates, and deep dives, click on the "Tracking Update" tab in the provided spreadsheet (annual premium reader only).
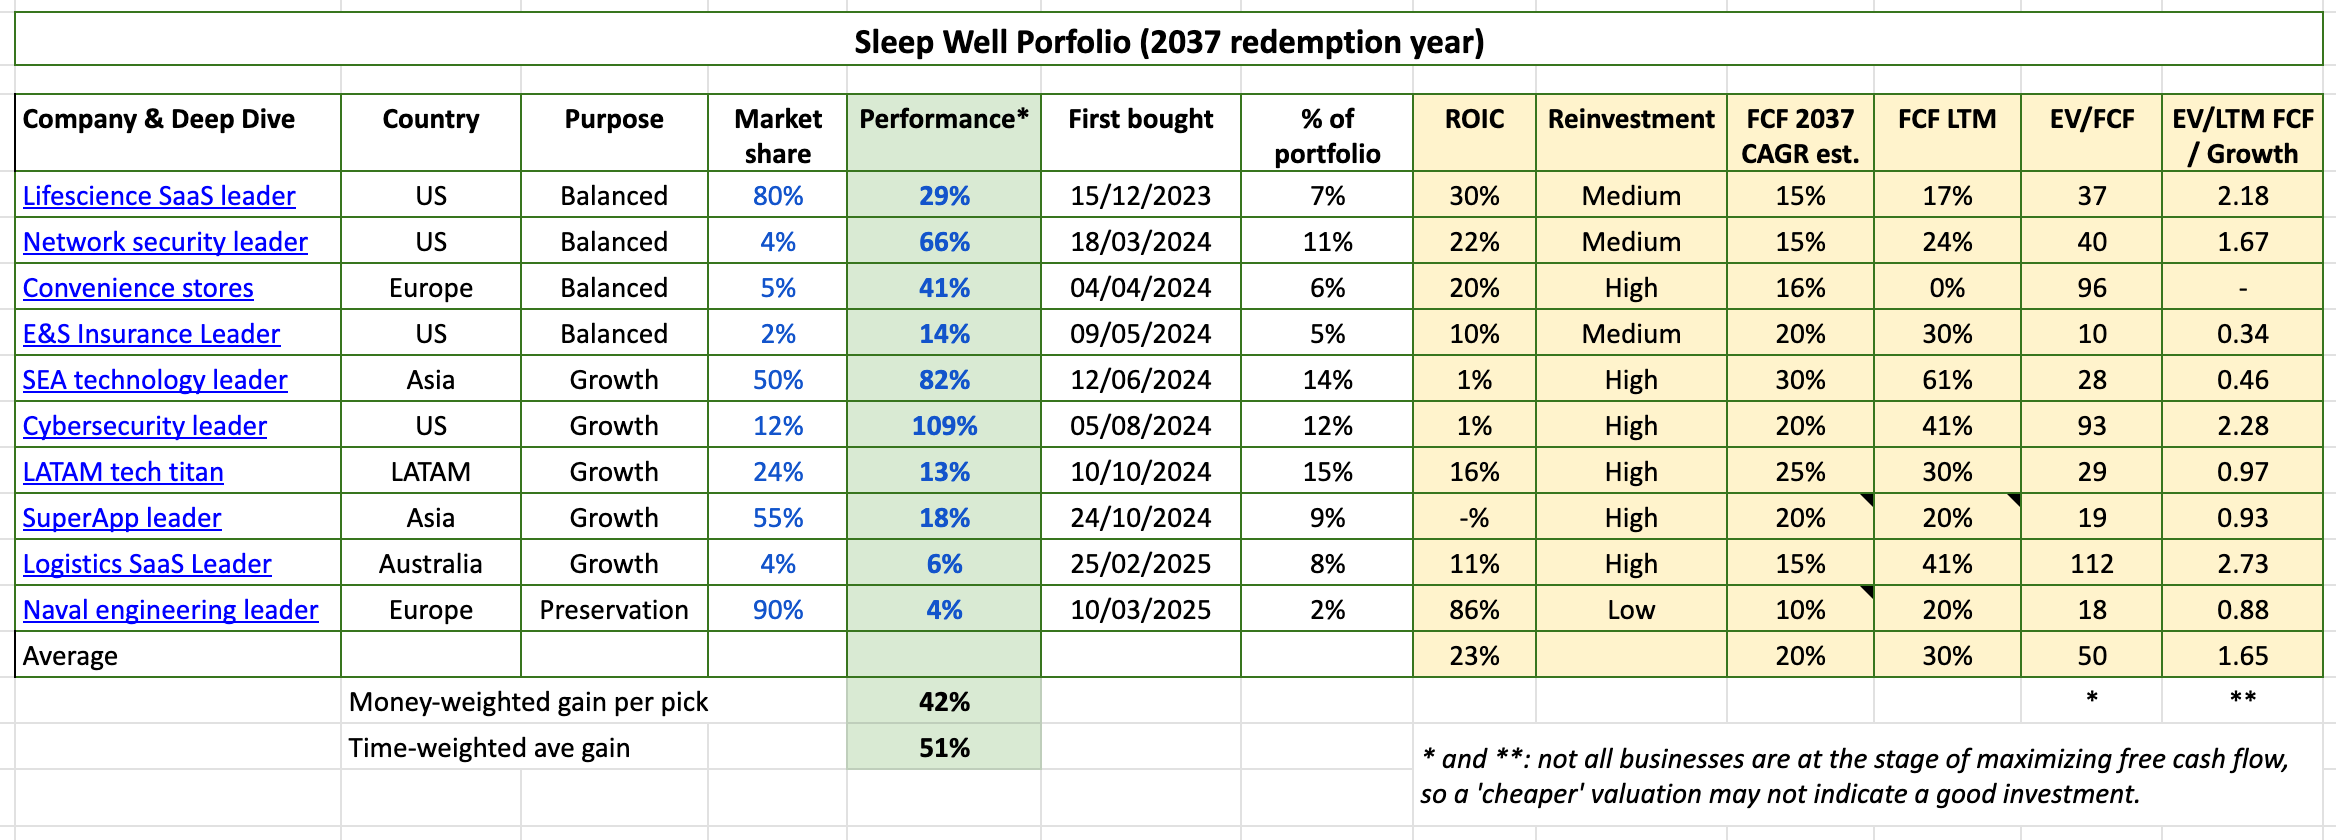
To see the latest portfolio review, click here. Annualized return per pick was 51%.
For all sleep-well write-ups, please visit this link.
Grab Q1’25 Results - KPIs.

All KPI are progressing in the right direction. GMV, Revenue, and Adj.EBITDA grew by 16%, 18%, and 71%, respectively, showing some operating leverage.
A few positives were:
Q1 revenue outperformed with transaction volume up 19% vs GMV up 16%, despite the Chinese New Year and Ramadan holidays.
Adj.EBITDA in Q1’25 was the 13th consecutive quarter of improving EBITDA.
HQ costs down 5% YoY, SBC down, while revenue increased nearly 20%.
Direct market costs in Indonesia (Grab’s most significant market ~30%) decreased by 12%, despite the country's ongoing slowdown (still 2.7% GDP growth).
Monthly transacting users (MTU) reached 45M and are still only 6% of the total population of Southeast Asia.
Four competitors dropped out in the past 18 months.
The tariff has had little impact so far, and forward demand remains strong, so guidance for 2025 has been raised to $3.7B revenue and $470M Adj. EBITDA, implying ~20% and ~50% growth, respectively.

Overall, no big surprises in Q1 or negative comments on tariffs, which we correctly analysed on April 7th.
Extending Grab’s KPI trend to Q1 of 2023, we see that the growth is a few percentage points slower (Q1 usually slowest), but direction has been relatively steady.

The rapid growth rates of ~20% in the last nine quarters are well-supported by a 17% user growth (Monthly Transacting Users) driven by a 16.6% incentive growth (both partner/drivers and riders).

One negative
Above, you can see that incentives in Q1 grew 20-22% higher than GMV growth and revenue growth. It's not a big issue now, but I’d like that number to be in line or lower.
Additionally, management explained that incentives grew faster because of Q1’s higher number of rides, which saw a 25% increase vs. 17% of GMV. Thus, we saw incentives outpacing in Q1. That’s reasonable.
However, looking back over the past four quarters, we see the trend magnified, with incentives growth at 32% compared to 17% in Q1’25.

Nevertheless, extending the horizon to two years doesn’t look as bad.
Adj. EBITDA and revenue grew by 157% and 24% CAGR, respectively, compared to 17% CAGR for incentives.

I’ll keep an eye on it, but I am pleased with the report.
Okay, let's move on to the more essential discussions: resilience, acquisitions, industry consolidation, AI, AV, fintech, advertising, and valuation.