

Hi, 5700+ sleep-well investors,
We are here to protect and grow your wealth while taking low risk. But risk is only low when you know what you own more than the market. I’ll front-load 100+ hours of research to ensure you only focus on businesses I consider low-risk.
To get the most out of Sleep Well Investments, this article provides a clear roadmap to the what, how, and why your wealth can be safeguarded by following my investment framework.
**As a reminder, Sleep Well Investments studies anti-fragile and time-tested businesses to make sure they generate predictable and above-market returns on our investments.**
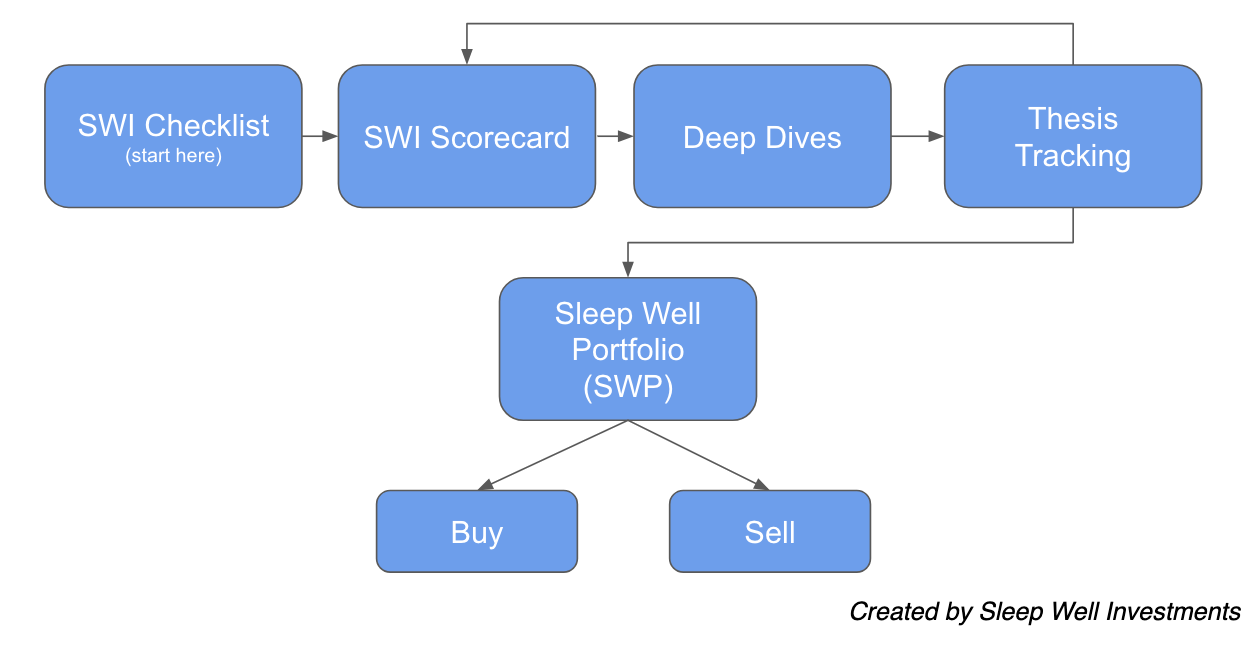
First, they earn a ‘sleep well’ label if they pass my rigorous Sleep Well Checklist (step 1), which gives out a score (step 2) to each business.
Then, their resilience is ‘stress tested’ against external adversities. I examine this in my deep dives (step 3).
Next, I track their KPIs using the Sleep Well Thesis Tracker (step 4) and buy/sell if they add value to the Sleep Well Portfolio (step 5).
I take a very methodical and patient approach to my portfolio construction, and I don’t let my emotions control my decisions.
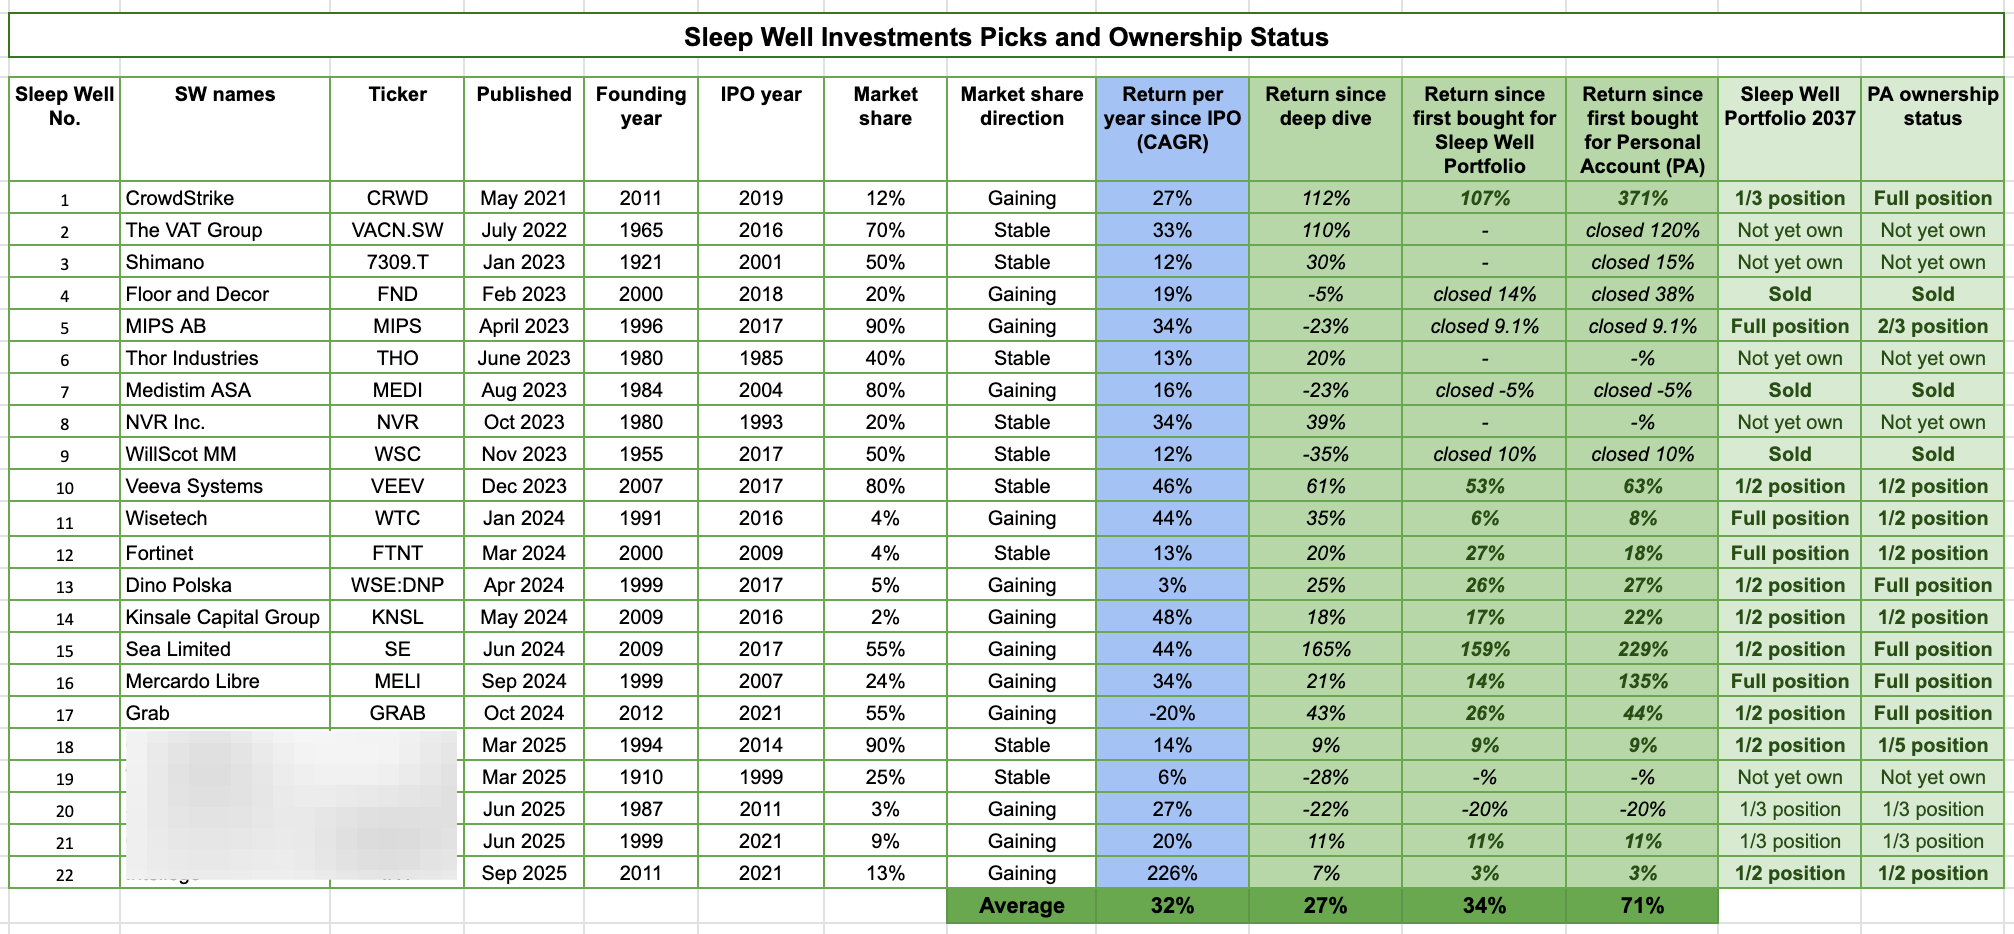
I intend to own around 15 businesses. I don’t chase ‘hot’ or ‘dirt cheap’ stocks nor flip ideas. I prefer to have a deep understanding and own great companies, and add slowly over time. I sell primarily because I find better opportunities. Some examples of annual returns for my picks are: Wisetech, 44% CAGR since IPO in 2016, and the 22nd pick, 220% CAGR since 2021. There is little need to flip around ideas.
Let’s go into the details of each step.
Framework in focus
If you are new to Sleep Well Investments, I present the flow chart again and explain the steps.
Links to each section
1. Sleep Well Investment Checklist
SWI is used to examine whether a business fits my investment philosophy.
At a high level, I have grouped the criteria into three categories in order of importance:
⏳ Survivability - Business quality [13 points]
🏃🏻♂️ Endurance - Competitive position and risks [4 points]
💰Valuation - Intrinsic Value [3 points]
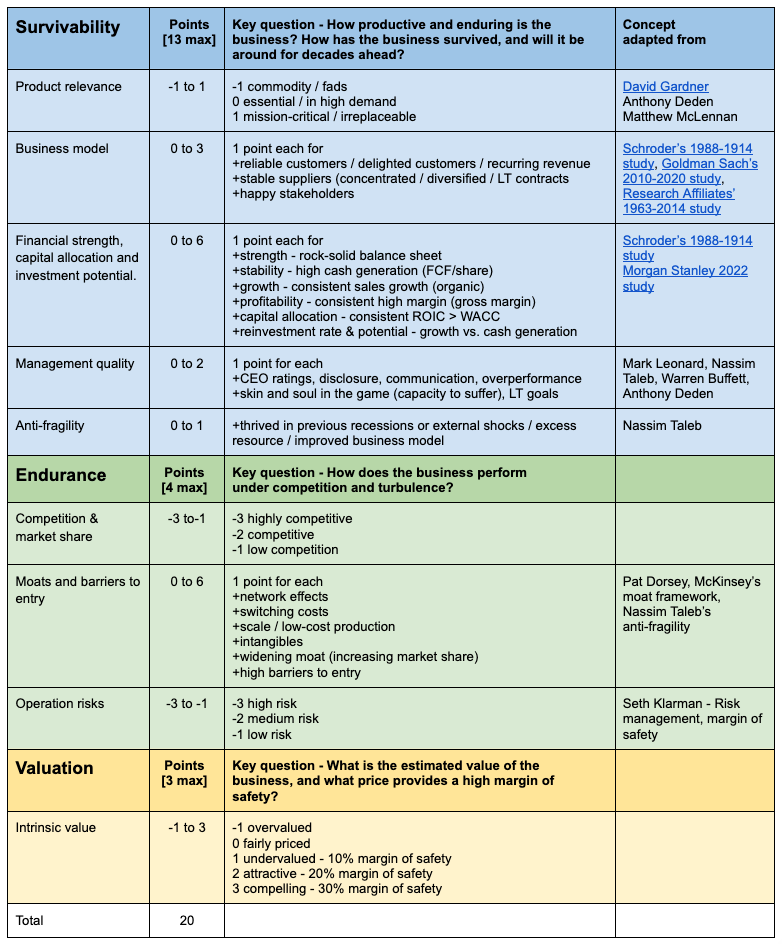
The first group examines how a business has withstood the test of time and the likelihood that it will remain viable for decades; the key lies in product relevance and the evolution of the business model.
The second group assesses whether the business can endure the pressure of competition and external shocks by measuring its moat development.
Finally, I employ multiple valuation methods to estimate a business's intrinsic value and establish a price range for acquiring a stake in companies that offer a high margin of safety.
Notice that business quality (17/20 total points) is more important than valuation (3/20 total points). For me, a business’s margin of safety comes mainly from its resilience rather than its cheapness. I’m not discrediting value investing; as you can see, overvaluations do get penalized under the SWI framework (i.e., they receive a negative score). However, I am more comfortable choosing a high-quality business at a fair price over a low-quality company at a cheap price.
The checklist was adapted from
Anti-fragility concept borrowed from Nassim Taleb,
Irreplaceability from Anthony Deden,
Mundane businesses from Matthew McLennan,
And various studies from other reputable investors (Terry Smith, Ralph Wanger, Scott Fraser, Peter Lynch, and more). They provided me with the knowledge and wisdom to judge if a business can endure the test of time.
Why did I create the SWI Checklist?
"Ultimately, nothing should be more important to investors than the ability to sleep soundly at night," Seth Klarman.
Unfortunately, I wasn’t sleeping well between 2018 and 2022.
I fell into the trap of buying companies that were growing at all costs and broken businesses at cheap valuations! While it looked great when the market was optimistic, it proved disastrous in uncertain times. With the benefit of hindsight, these baskets of stocks dropped the hardest.
This numbing experience led me to change my investment process radically.
From that day on (2022) -
I only considered time-tested businesses that can defend their moats and reinvest at a high return on invested capital over time — high-quality companies.
I only buy these businesses when they perform on the SWI Thesis Tracker and when the price is right. — disciplined ownership
To earn a position in my Sleep Well Portfolio, they must score at least 13/20 points on the Sleep Well Investment Scorecard (below).
2. Sleep Well Investment Scorecard
I score each business based on the Checklist. As mentioned above, there are three groups:
⏳Survivability - Business quality [13 points]
🏃🏻♂️Endurance - Competitive position and risks [4 points]
💰 Valuation - Intrinsic Value [3 points].
Each of the criteria under these 3 categories also has a range of points; for example, a business can score 0, 1, or 2 for ‘Management’, or be deducted 1, 2, or 3 points for the level of competition under ‘Competition and Market Share’.
There are 20 points in total. I consider a business investable if it has more than 13 points. Below, you will find the criteria in the SWI Checklist and their corresponding scores for some of the companies that SWI has analyzed in 2024-2025.
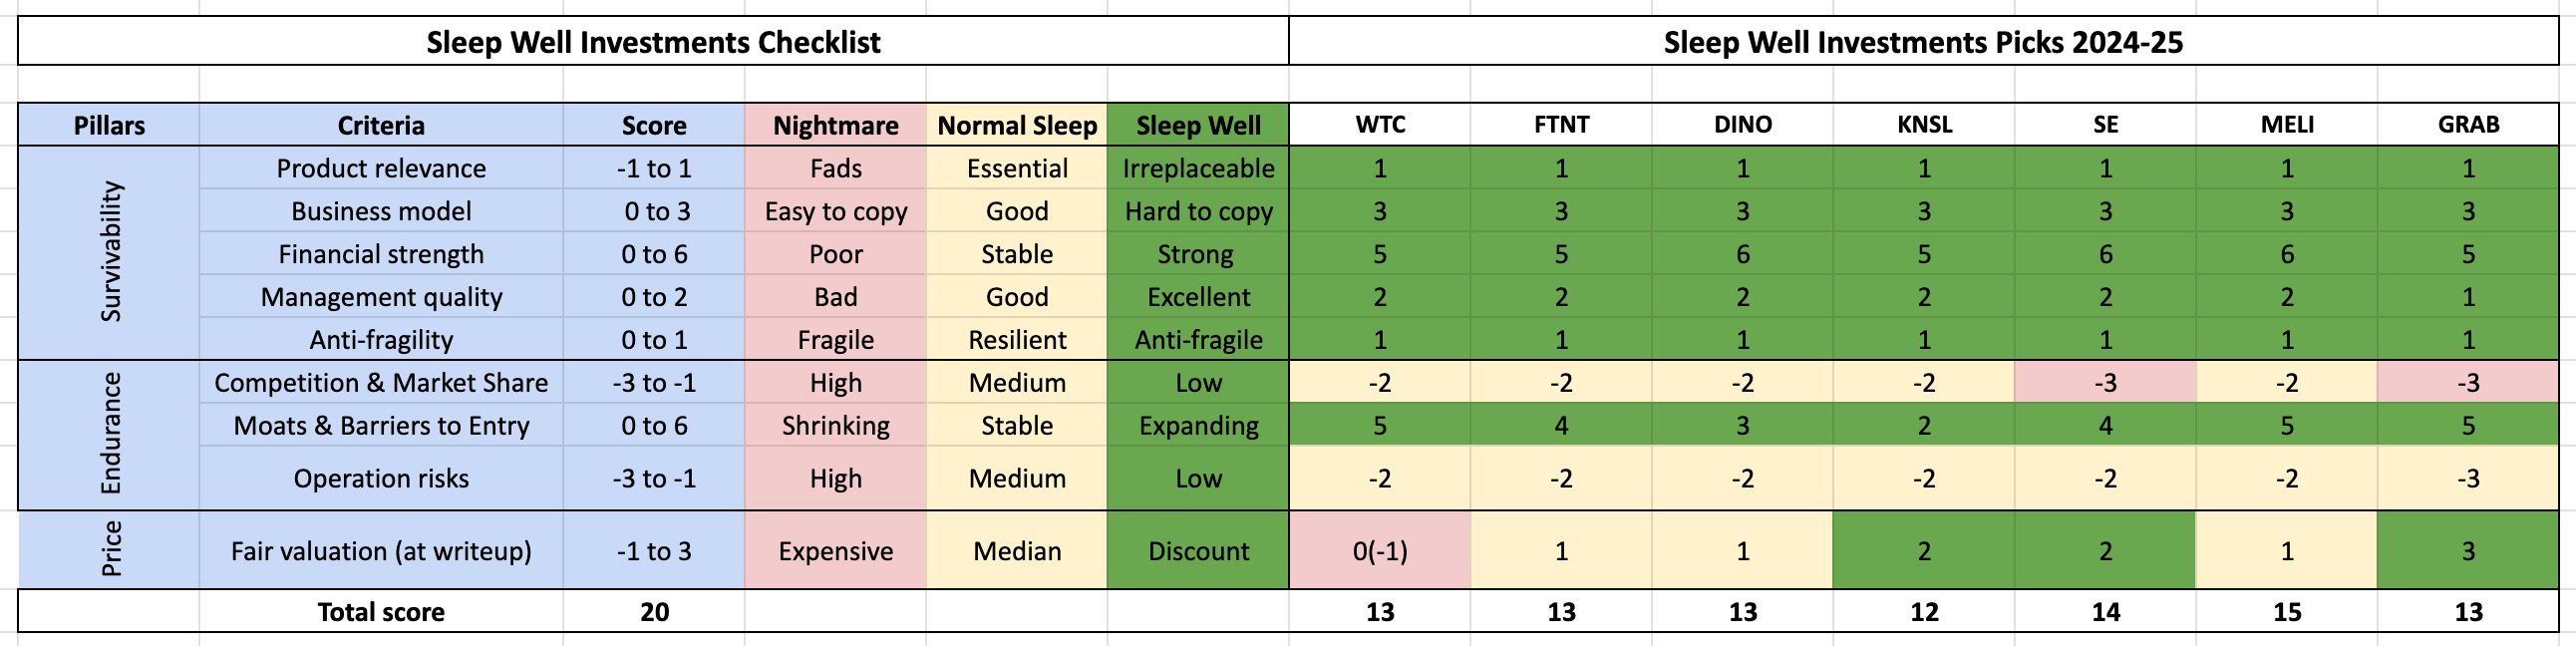
These companies are niche market leaders and have a very long runway for reinvestment.
The catch is that they are rarely offered at a reasonable price, which means you will need to own them for decades so that the value they will create outweighs the initial multiple you paid. Alternatively, you can try to find relatively unknown and under-appreciated (mostly boring) businesses. BCG research shows that sales, profit, and free cash flow drive 95% of stock performance, while valuation drives just 5% over 10 years.

3. Deep dives
A deep dive is a report (~10,000 words) where you can expect a breakdown of
how the business has built its success,
how it will overcome competition and future adversities, and
a simple valuation framework to ensure we buy at a reasonable price.
In addition, it will give you the reasoning behind each of the scores in the SWI Scorecard.
Every industry and business model is different, but I always dig deep into understanding why the chosen company has a better product/platform, how it can adapt to changes, and what barriers it has built for new entrants. That, to me, is most important and will contribute the most to our sleep-wellness.
🔗 link - for all deep dives
4. Thesis tracking
I track the progress of each business in SWP and decide whether they still deserve a place in the Sleep Well Portfolio regularly. You will receive a write-up when any substantial changes affect the company. I also update the Sleep Well Scorecard if necessary.
Sleep Well Investments only stay ‘sleep well’ if they continue overcoming the competition and unknowns over time. They must perform and adapt to remain on the watchlist/portfolio, which I track under my Thesis Tracking updates.
It often boils down to one KPI - market share movements against key rivals - my proxy for the quality of the moats and barriers to entry.
🔗 link - Check out the Thesis Tracker section for follow-up updates.
Behind the KPI is a comparative report of (i) revenue growth, (ii) major client wins/losses, (iii) industry rankings, and sometimes (iv) product reviews, if relevant. You will know the market share movements and the why and how they gain/lose.
FREE tracking reports: MIPS, CRWD, and FND.
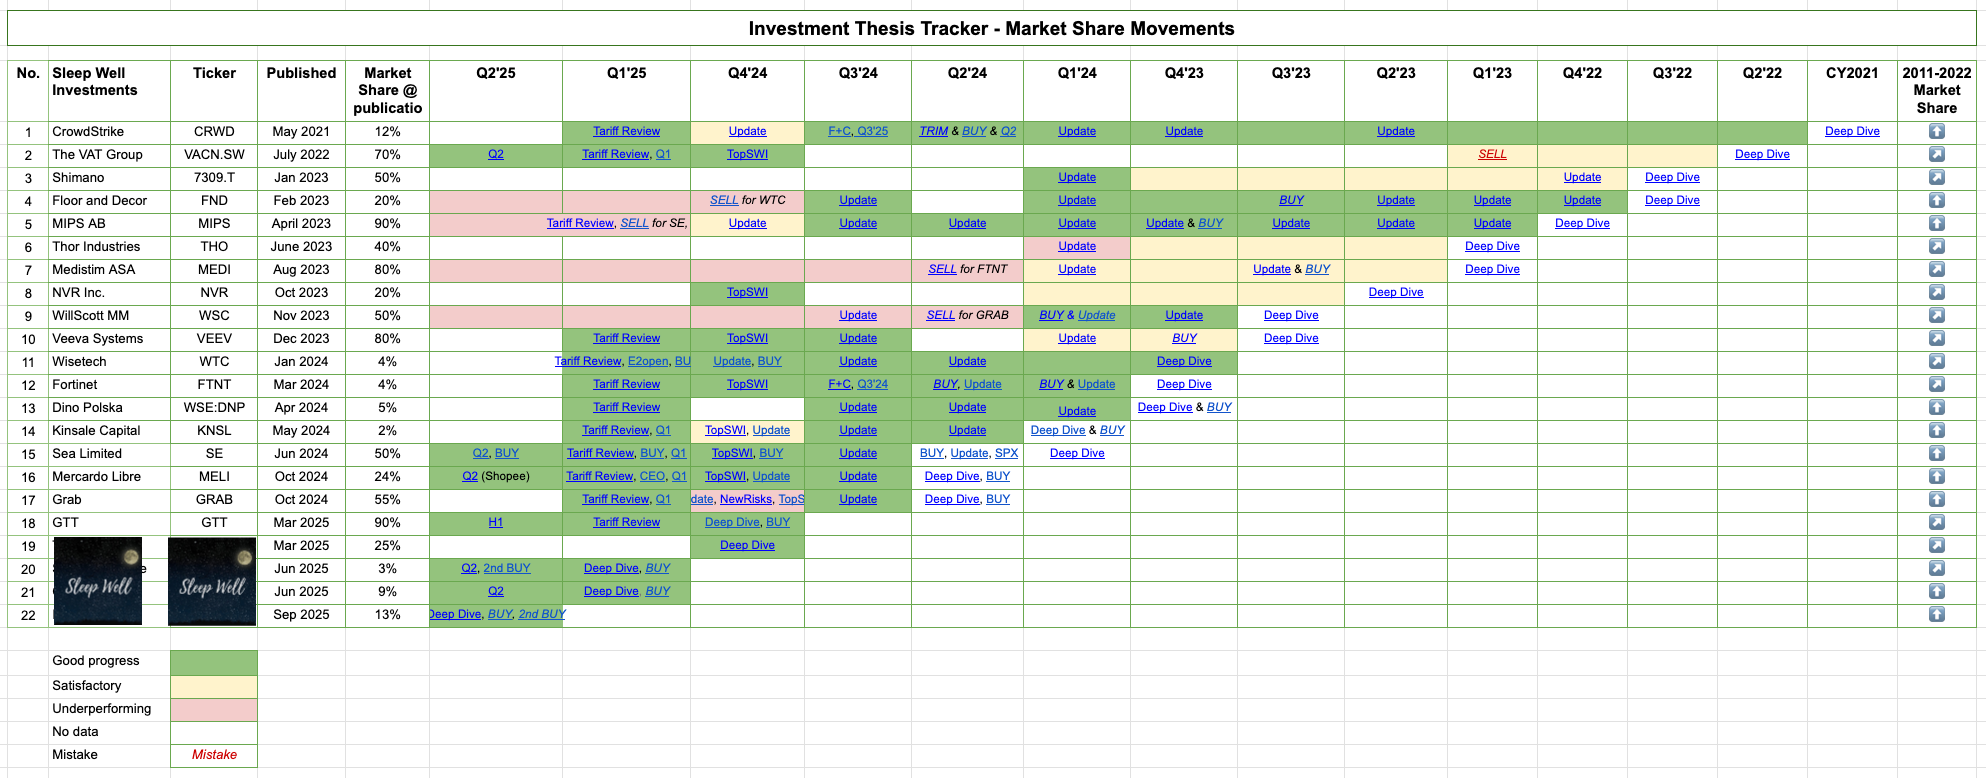
As shown in the table above, green indicates gaining market share, red indicates losing, and yellow indicates stability. Gaining or losing market share speaks volumes about the quality of the moats and barriers to entry.
Consider this:
A business expanding its market share relative to key rivals is likely a result of widened competitive moats and stronger pricing power. In theory, this should enable the company to sell products at a higher price, purchase supplies at a lower price, and enter new markets and products more effectively. Operationally, that likely leads to better cash conversion and higher free cash flow per share growth. From an investment perspective, the return on invested capital (ROIC) is likely higher than its peers.
Market share movements encapsulate all the underlying aspects above. Simple and elegantly effective.
Tracking market share also encourages investors to think long-term and provides an excellent opportunity to verify the business quality (Sleep Well Investment Scorecard).
5. Sleep Well Portfolio (SWP)
Annual subscribers get full access to the SWP, which is my daughter’s JISA with a redemption date of 2037. I use it to demonstrate how I would construct a long-term portfolio from scratch.
🔗 link- to track the portfolio in real-time (available to annual subs only)
What makes the Sleep Well Portfolio sleep-well?
✔ The portfolio will consist of between 10-20 market leaders
✔ The portfolio consists of businesses that we want to own long-term, hence the 2037 redemption date.
✔ No market timing. We buy at a price that offers a healthy margin of safety
✔ The portfolio only invests in deep-dived stocks that are monitored closely
✔ They are market leaders who:
have a stable / strengthening market position
have enduring competitive advantages
have management with aligned interests and a strong capital allocation track record
have anti-fragility attributes (i.e., a healthy balance sheet, excess capability, an adaptable business model, and have previously endured competitors and crises)
have plenty of reinvestment opportunities
is trading at a fair valuation
Investing is a life-long journey, not a sprint. That’s why the portfolio redemption year is 2037. I buy stocks that I intend to keep for the long-term, so no short-term trades. A few extra percentage points of return aren’t as important as sleeping well, achieved through knowing why I own a business and trusting my investment process.
For this reason, access to the portfolio is only available for annual paid subs who are in it for the long run. I apologize to monthly subscribers; I don’t want to mislead or tag you along for a marathon when you are looking for a sprint. You will still have full access to my deep dives and thesis-tracking updates.
Important note: It doesn’t matter if you manage a $50K or a $50M portfolio; if you can’t manage a small amount responsibly, then managing $50M will magnify your mistakes. Hence, I do not provide ownership details in absolute $ value.
The purpose of showing how I manage my daughter’s and my family's portfolio is to encourage long-term ownership, showing I eat my own cooking, and that it is possible to have a lasting investment process over multiple cycles. Please don’t copy it blindly; your saving is finite; treat it responsibly. It’s likely we have very different financial goals and circumstances.
Finally, I will only reveal new Sleep Well Portfolio positions after publishing my deep dive. I believe an investor should only consider an investment after thoroughly researching it.
6. Sleep Well Portfolio *Buy/Sell Alert*
For transparency and disclosure, I share my detailed thought process behind every BUY and SELL. I also review the portfolio monthly.
🔗 link here - to view all buys and sells (available to annual subs only)
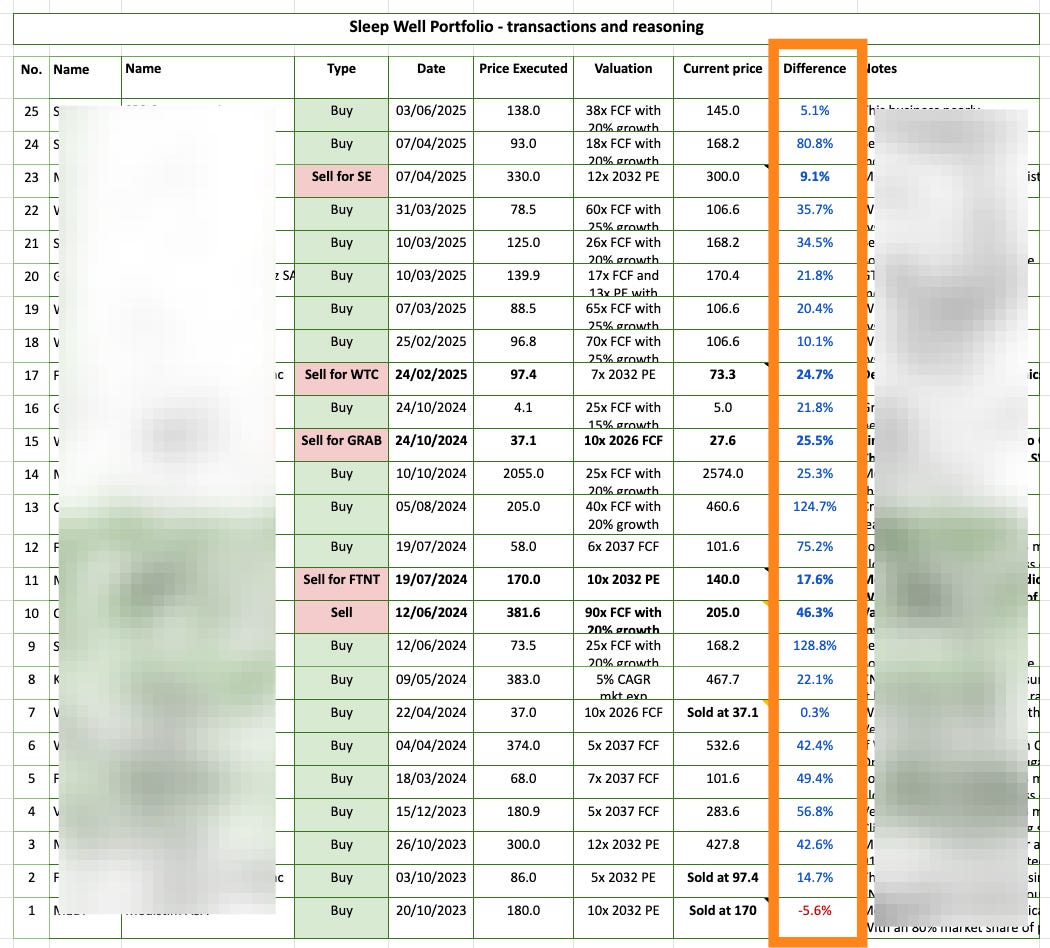
I aim to own these businesses as long as they perform well in my Thesis Tracker, which I update as new data becomes available.
I believe in ‘knowledge is key’, so as a paid member, you will also get access to
Key lessons I’ve learnt throughout my investing journey
My write-ups on quality traps, i.e., companies that seem like a good investment at first but under the surface lie more permanent issues.
The checklist/scorecard approach is smart. At Phaetrix I frame it as style discipline — value, growth, dividend, etc. Different wrappers, but the same end goal: protect capital and compound without losing sleep.
The Mother of Growth is the MoAT.
A.
The four sources of structural competitive advantage are intangible assets, customer switching costs, the network effect, and cost advantages.
If you can find a company with solid returns on capital and one of these characteristics, you’ve likely found a company with a moat.
— Pat Dorsey
B.
Analysis:
Network Effect is manifested in the Asset Turnover Ratio (Rev/Total Assets)
Intangible Assets & Customer Switching Cost are manifested in the 1st Level Profit Efficiency Yield, namely Gross Profit Yield from Revenue (GP/Rev).
Company Operational Cost Advantage is manifested in the 2nd Level Profit Efficiency Yield, namely The Quality of Gross Profit, i.e. Net Profit Yield from Gross Profit (NP/GP).
MoAT
= Synergized Structural Competitive Advantage
= Network Effect × (Intangible Assets & Customer Switching Cost) × Company Operational Cost Advantage
= Asset Turnover Ratio × Gross Profit Yield from Revenue × Net Profit Yield from Gross Profit
= Rev/Total Assets × GP/Rev × NP/GP
= GPA × NP/GP
= NP/Total Assets
= ROA